Networked Environment Series, For Part 2, click here
Most labs don’t struggle because they lack data.
They struggle because the data lives in too many places.

Introduction: when your data lives in different worlds
Picture this: a busy analytical lab. Instruments are running samples around the clock, chromatograms are piling up, everything seems fine — until something isn’t. A questionable peak appears, a sequence looks incomplete, or a batch record doesn’t quite match expectations.
The first call usually goes to the analyst:
“Can you help me work out where this came from?”
And that’s when the hunt begins.
Some information is digital, some lives in flat files on instrument PCs, and some is still trapped in paper logbooks or handwritten notebooks. Workstations act like small, disconnected islands — each containing fragments of the bigger picture, but none holding the full story.
Eventually, you can piece it together — but only through old-fashioned detective work: searching folders, flipping through logbooks, cross-checking timestamps, and hoping nothing has been overwritten or misplaced along the way. And because flat files can be copied, edited, or moved without traceability, you’re never completely sure you’re looking at the definitive source.
Now imagine a different world:
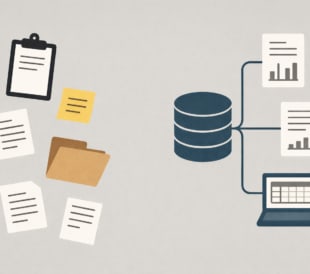
All your information — sequence actions, instrument conditions, method versions, users, audit trails — automatically flows into a central, secure system. Everything is linked, traceable, and searchable.
Instead of chasing clues, the story is already assembled.
It’s less like sifting through notebooks and more like the air-traffic control of your lab: one connected view where flights (samples), pilots (analysts), aircraft (instruments), schedules (sequences) and maintenance logs (audit trails) all come together in real time to ensure safe, reliable operation.
That is what a networked, database-driven environment delivers.
This vision sounds compelling — but why do so many labs still struggle to get there?
And what specifically holds traditional systems back?
From silos to systems: why a connected backbone matters
Many legacy or workstation-centric systems still store data as separate files or “projects” — like keeping stacks of binders on different benches. It may feel familiar, but it makes it hard to connect information across:
• instruments
• analysts
• batches
• shifts
• and especially across labs or sites
You can find a single result quickly, but try answering broader questions and the limitations show:
• Are our results consistent this month across all instruments?
• Which site or shift shows more variability?
• Are we spotting early signs of a trend?
A modern connected environment is a game changer. Instead of storing isolated files, it stores relationships — linking data points automatically: results → instruments → sequences → methods → analysts → timestamps.
And because everything is searchable and queryable, you can ask these questions directly — without exporting, merging, or guessing.
Most people use relational data every day without realizing it.
A relational database is like an airline booking system
It links:
• passengers
• flights
• aircrafts
• airports
• schedules
If you want to know who flew where, when, and on which aircraft — it takes seconds.
No one is searching through folders of printed tickets.
A relational database means:
• Your data is structured
• Your data is connected
• Your data is searchable
• Your data is interpretable
• Your data is traceable
In other words: not just stored, but usable — especially in a multi-instrument, multi-lab, or networked environment.
What this looks like in practice
• Central visibility & management
IT can manage configurations, access, updates, and integrity centrally — not PC by PC.
It’s like monitoring all incubators from one dashboard instead of checking each room manually.
• Simplified backup & recovery
One controlled environment protects the whole operation.
It’s backing up a central digital archive, not chasing 12 independent logbooks.
• Faster insights, instantly
Because relationships are already mapped, queries become answers — not chores.
Search → visualize → report.
No exporting. No merging. No detective work.
Connected data sounds powerful — but what does this actually change day to day?
How does it impact IT, Quality teams, reporting, and compliance?
In Part 2, I would like to share my Top 3 things to consider when turning data into insight, and why it builds lasting confidence in lab data.
In the meantime, take a look at our Chromeleon knowledge byte webinar series or visit the Chromeleon university for more how-to-videos.
Visit us on LinkedIn: #Chromeleon #Software #LabProductivity
From Scattered Files to Clear Insights (Part 2): How Connected Data Transforms the Lab
Networked Environment Series In Part 1, we explored why revi...
Read More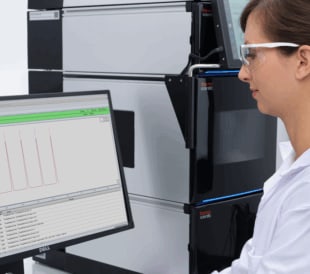
Elevate Your HPLC Performance with a Modern CDS
You may have the best HPLC system on the market, but to maxi...
Read More
Episode 2: The Benefits of CAD Compared to Other Universal Detectors: ELSD and MALS
Welcome back to our series on Charged Aerosol Detection (CAD...
Read More
Episode 1: The Benefits of Charged Aerosol Detection (CAD) in High-Performance Liquid Chromatography (HPLC)
High-Performance Liquid Chromatography (HPLC) is a cornersto...
Read More