Search

Applied Biosystems™
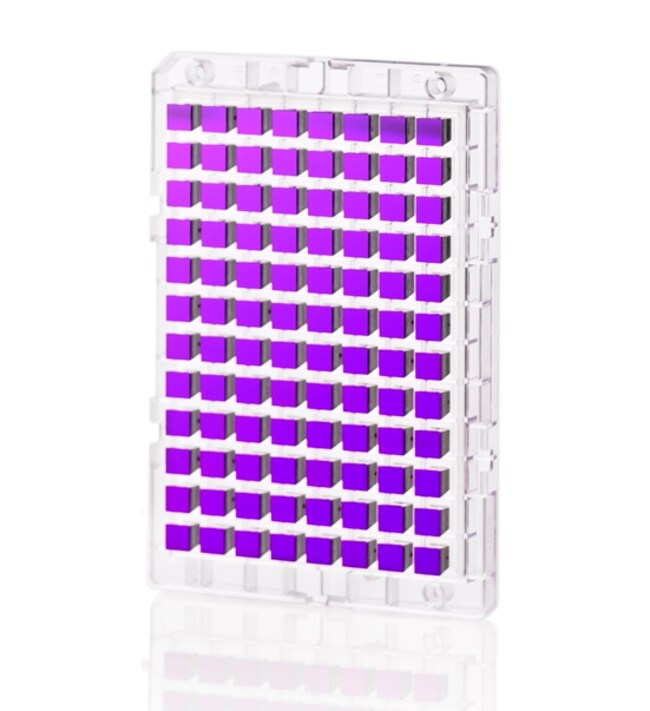
GeneChip™ Rat Gene 2.1 ST Array Plate
The Rat Gene 2.1 ST 24-Array Plate and Trays enables high-throughput expression profiling of 24 samples at a time usingRead more
Have Questions?
Change view

| Catalog Number | Number of Arrays |
|---|---|
| 902144 | 96 arrays |
| 902143 | 24 arrays |
Catalog number 902144
Price (CNY)
-
Number of Arrays:
96 arrays
The Rat Gene 2.1 ST 24-Array Plate and Trays enables high-throughput expression profiling of 24 samples at a time using the same content as the industry-standard GeneChip™ Rat Gene 1.0 ST Array.
Comprehensive design
We understand that rats are an important model organism commonly used for studying human disease. In order to keep your experiments relevant to the understanding of the transcriptome, we have designed an array based on the most recent genome content for generating genome-wide expression profiles.
The GeneChip Gene ST family of arrays offers a unique feature not available in other microarrays. Unlike traditional array designs that rely on a probe(s) designed to the first exon of the gene's 3' end, the hundreds of thousands of probes on each Gene ST Array Plate are designed to every exon of every transcript represented on the array.
The high transcript coverage (median of 22 probes per gene) yields accurate detection for genome-wide transcript expression changes. These arrays provide higher resolution and accuracy than many of the classical 3'-biased microarray solutions available. The whole-transcript analysis approach enables researchers to detect multiple transcript isoforms from a given gene, including those that could be missed using a 3'-biased expression design, such as splice variants, non-polyadenylated transcripts, transcripts with alternative polyadenylation sites, and truncated transcripts.
Key benefits
• Whole-transcript analysis enables the capture of transcript isoforms you may miss with 3'-biased expression designs• Comprehensive transcriptome coverage provides the best opportunity to discover interesting biology:
- >27,000 protein coding transcripts
- >24,000 Entrez genes
• Measure alternative splicing events/transcript variants with probes designed to maximize coverage of exons
• Reproducible: Signal correlation coefficient ≥0.99
Content profile
Since the design of Rat Gene 1.1 ST Array Plates (sold separately), there has been a substantial increase in the structural and functional understanding of the rat genome. This increase in knowledge includes the identification of a large number of long intergenic lincRNA that have been identified by the research community. In order to provide the research community with a tool that can measure the differential expression of this exciting class of RNA transcripts, we designed the Rat Gene 2.1 ST Array Plates.
For Research Use Only. Not for use in diagnostic procedures.
Specifications
Product LineGeneChip
Quantity1 x 96 array plate
TypeRat Gene 2.1 ST Array Plate
ArrayTranscriptome Profiling
FormatArray Plate and Trays
Number of Arrays96 arrays
SpeciesRat
Unit SizeEach