Search

Applied Biosystems™
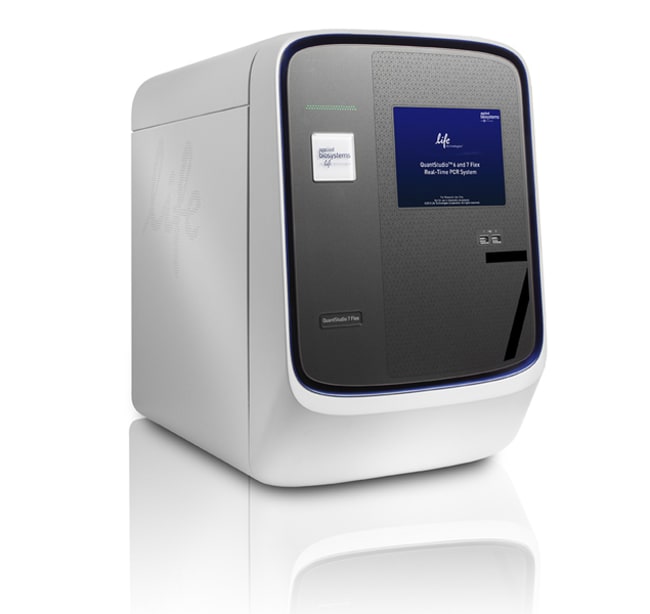
QuantStudio™ 7 Flex 实时荧光定量 PCR 系统,阵列卡,台式计算机
Applied Biosystems® QuantStudio™ 7 Flex 实时荧光定量 PCR 系统通过其多通路功能和可互换模块形式实现多种基于实时荧光定量 PCR 的应用,从而进一步推进您的研究了解更多信息
| 货号 | 数量 |
|---|---|
| 4485696 | 1 system |
货号 4485696
价格(CNY)
-
数量:
1 system
Applied Biosystems® QuantStudio™ 7 Flex 实时荧光定量 PCR 系统通过其多通路功能和可互换模块形式实现多种基于实时荧光定量 PCR 的应用,从而进一步推进您的研究。通过简化的工作流程、直观的软件、自动化功能和触摸屏界面,QuantStudio™ 7 Flex 系统可提供极佳的重现性,并且具有极小的孔间和仪器间差异。
QuantStudio™ 7 Flex 实时荧光定量 PCR 系统的特点包括:
•通过调节 4 种不同模块类型,增加应用的多功能性
•与超过 8 百万 TaqMan® Assay兼容,用于基因表达、基因变异、基因调控或蛋白表达实验
•QuantStudio™ 平台的智能设计与 Applied Biosystems® 仪器的可靠性和准确性相结合
•易于使用的软件、响应触摸屏、自动化功能以及无需任何工具的轻松模块交换
Thermo Fisher Cloud
Thermo Fisher Cloud 为科学家储存、分析和共享数据提供了一个安全平台。Thermo Fisher Cloud 中的 Applied Biosystems qPCR 分析模块是基于网络浏览器的软件工具,灵活、快速且易于使用。这些工具与 Mac 或 PC 以及大多数 Applied Biosystems 仪器文件类型兼容。
>>下载 QuantStudio™ 7 软件 90 天试用版
QuantStudio™ 7 Flex 系统可容纳 96 孔、96 孔快速、384 孔或 TaqMan® 阵列卡封闭的互换。系统自带一种模块类型(本例中为阵列卡模块);其他模块类型可单独购买。此外,该系统还可兼容 Twister® 自动化附件,以支持高通量工作流程。对于不支持 TaqMan® 阵列卡或自动化操作(但可以在后期升级以支持该操作)但更具价值的系统,请参见我们的 QuantStudio Pro ™6 Flex 系统。为实现极高的灵活性,请考虑同样可容纳 TaqMan® OpenArray® 板的 QuantStudio™ 12K Flex 系统。
实现更多、更快
使用 TaqMan® 阵列 384 孔微流控卡轻松运行数百次实时荧光定量 PCR 反应。当与 Twister® 自动化附件(单独提供)集成时,QuantStudio™ 7 Flex 系统会尽可能增加您通量能力。
高应用多功能性
可提供简单工作流程、可靠的测定和试剂、多种规格以及直观的软件用于多种应用,包括基因表达、基因变异、基因调控、高分辨率熔解 (HRM) 和 Protein Thermal Shift™ 实验等。
值得信赖的结果
使用 OptiFlex™ 系统可提高孔间和仪器间的数据准确度,该系统具有含 21 个滤光片组合的 6 个激发和发射滤光片通道,以尽可能增加多通路和化学灵活性。
敏感数据分析
检测单重反应中低至 1.5 倍的靶标数量变化,并获得 10 对数的线性动态范围。
仅供科研使用。不可用于诊断程序。
规格
显示类型触摸屏
适用于(设备)QuantStudio™
产品规格384孔微流体卡
产品线QuantStudio
数量1 system
模块规格可互换
Unit SizeEach
内容与储存
便携式计算机