Search

Applied Biosystems™
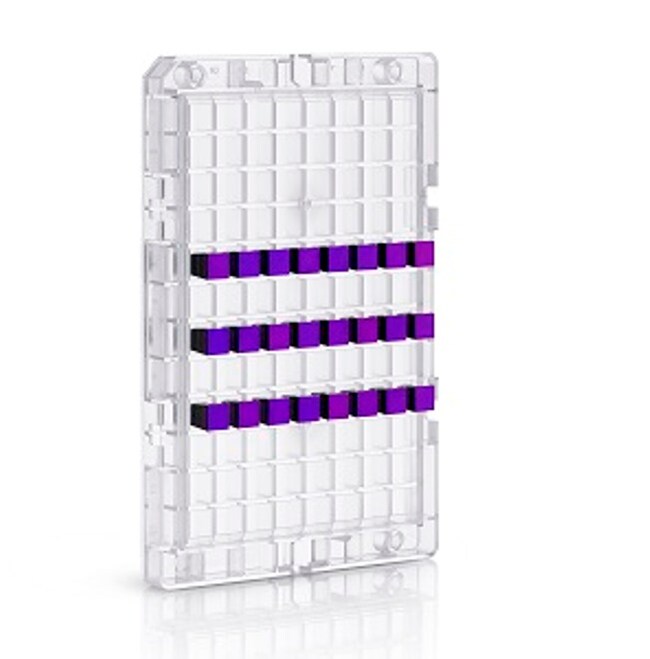
GeneChip™ 大米基因 1.1 ST 阵列板,美国
GeneChip™ 大米(美国)基因 1.1 ST 24 阵列板使您能够:•检测该片段在整个基因中的表达情况,且分辨率和准确度均高于经典 3'-端偏倚微阵列方案• 通过对每个转录本进行多次独立测量获取精确且可重现的数据•了解更多信息
| 货号 | 数量 |
|---|---|
| 901989 | 1 plate |
货号 901989
价格(CNY)
-
数量:
1 plate
GeneChip™ 大米(美国)基因 1.1 ST 24 阵列板使您能够:
•检测该片段在整个基因中的表达情况,且分辨率和准确度均高于经典 3'-端偏倚微阵列方案
• 通过对每个转录本进行多次独立测量获取精确且可重现的数据
• 使用 GeneTitan™ 仪器在单个阵列板上处理多达 96 份样品
基因表达微阵列开发
对比较基因组学研究、进化生物学而言,模型及应用研究微生物拥有巨大价值,并且在破译人类疾病的分子机制及农作物改良方面将持续发挥关键作用。基因 1.1 ST 阵列板已被开发用于检测多种模型和应用研究生物。这些生物体是不断壮大的基因表达微阵列家族的最新成员,可提供全转录本覆盖。基因 1.1 ST 阵列板由我们与知名研究人员合作设计,如 Roslin 研究所遗传学和基因组学部主任 Alan Archibald(猪基因 1.1 ST 阵列设计)、干细胞研究计划主管 Leonard Zon 和波士顿哈佛医学院儿童医院干细胞研究项目的基因组核心主任 Yi Zhou(斑马鱼基因 1.1 ST 阵列设计)。
关键优势
• 较高的转录本覆盖度 — 对良好注释内容进行可靠的表达测定,每个转录本含高达26个探针
• 全转录组分析 — 可捕获 3’ 端偏倚表达设计可能遗漏的转录本亚型
• 高数据相关性 — 可实现较高的阵列条带间和阵列条带内的信号相关性 (R >0.99)
• 方便的形式 — 可同时处理多达96份样品,仅需较少的手动阵列处理
符合行业标准的成熟性能
基因 1.1 ST 阵列板实现所选模型和应用研究微生物的全转录组覆盖。所有设计均基于较新的基因组内容,并且提供较高的探针覆盖范围(完整长度基因中可多达 26 个探针)。这使得它可以精确进行全转录组微阵列分析检测,并可提供比市场上其他经典 3'-端偏倚微阵列方案更高的分辨率和准确性。全转录组分析方法使研究人员能够检测多个转录本亚型,包括使用 3’-端偏倚表达设计时可能遗漏的亚型,如剪接变异、非多聚腺苷酸转录本、带有选择性多聚腺苷酸化位点的转录本以及截短转录本。
内容概况
基因 1.1 ST 阵列板可以覆盖较新的转录基因组范围。我们使用全面的信息源来设计用于检测每个转录本多达 26 个独特序列的探针。全部这些 26 种独特的 25-mer 探针可检测每个转录本至多 650 个碱基。整个转录本的高探针覆盖度带来了出色的性能和数据可信度,同时也能够随着您对每个基因组和转录组的理解加深时更新您的实验数据。
仅供科研使用。不可用于诊断程序。
规格
产品线GeneChip
数量1 plate
类型大米基因 1.1 ST 阵列板
数组转录组谱分析
产品规格24 阵列板
阵列数量24 阵列
种属大米(美国)
Unit SizeEach