Search

Applied Biosystems™
Clariom™ D Pico Assay,人类
采用用于人类样品的 Clariom D Pico Assay(新一代的转录组水平表达谱分析工具),可以更快速地从转录组深处发现生物标记物。Clariom D Pico了解更多信息
Have Questions?
更改视图

| 货号 | 阵列数量 |
|---|---|
| 902925 | 30 阵列 |
| 902924 | 12 阵列 |
货号 902925
价格(CNY)
-
阵列数量:
30 阵列
采用用于人类样品的 Clariom D Pico Assay(新一代的转录组水平表达谱分析工具),可以更快速地从转录组深处发现生物标记物。Clariom D Pico Assay 可详细显示转录组细节视图,采用更快的路径获取研究所需结果。Clariom D Pico Assay 可让转录研究科学家快速简单地得到高保真度的生物标记物特征。新型 Clariom D Pico Assay 设计基于行业前列的微阵列技术,提供了较为复杂的全转录组范围基因水平和外显子水平的表达谱,包括在为期三天的单一实验中,检测编码和长链非编码 (lnc)RNA 的选择性剪接事件的能力。
拓展发现新型、信息丰富生物标记物的潜力
近年来快速扩展的已知转录基因数量,为可操作性的生物标记物(例如转录变异和 lncRNA)提供了更多的来源,这可用于临床应用和促进对疾病机制的理解。这类生物标记物可能会被冗长、复杂且昂贵的测序和靶向表达方法所遗漏,从而导致特征难以重现,浪费时间和金钱。
Clariom D Pico 测定试剂盒可全面覆盖转录基因组(包括所有已知编码和未编码的剪接变体),与临床样品类型兼容并提供灵活的数据分析软件,因此它是转译研究人员执行复杂表达生物标记物发现研究并希望以极快速度获得可靠、临床相关且可行结果的首选工具。
获取所有所需数据
• 在从样品量庞大的公共数据库中获得的 >540,000 个转录本中快速鉴别复杂的疾病特征,该数据库较全面地覆盖现有人转录组,从而确保不会遗漏生物标记物。
•可靠地检测产生编码 RNA 和 lncRNA 亚型的基因、外显子和其他选择性剪接事件。
•检测罕见的低表达转录本,而一般的测序方法检测不到这类转录本。
•借助直观、高度可视的免费分析软件,在几分钟之内即可从数据获得洞察力。
对于贵重样品,可一举成功。
• 可从总 RNA 量低至 100 pg 的样品中—以及低至 10 个细胞样品中,生成具有可靠性的表达谱。
• 使用来自不同样品类型的 RNA,包括血液、细胞、新鲜/新鲜冷冻或 FFPE 组织。
• 该检测可保持样品完整性并降低数据变异性,且无需球蛋白或 rRNA 去除步骤。
Clariom D 解决方案以单一样品(检测盒阵列)格式提供,可在 GeneChip ™ 3000 仪器系统上使用,包括试剂和快速简单的转录组分析控制台 (TAC) 软件,该软件可分析和显示基因、外显子、通路和选择性剪接事件。
获得所需要的覆盖范围、所需的可重现性以及有意在发现中发挥作用的结果。
仅供科研使用。不可用于诊断程序。
规格
产品线Applied Biosystems
数量30 次反应
运输条件经批准可在室温下或者湿冰或干冰上运输
类型D Pico Assay
数组转录组谱分析
产品规格阵列检测盒
阵列数量30 阵列
种属人
Unit SizeEach
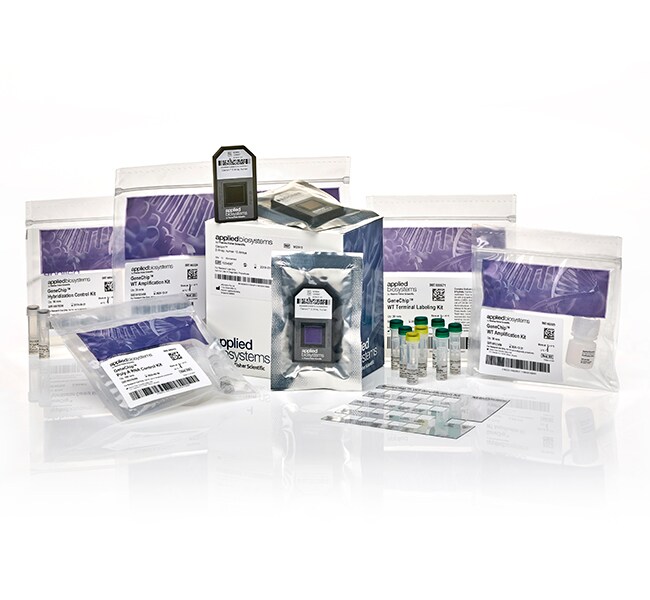
内容与储存
• 对照 HeLA RNA,储存于 -20°C
• 杂交对照试剂盒,储存于 -20°C
• WT Pico 扩增试剂盒,模块 1,储存于 -20°C
• WT Pico 扩增试剂盒,模块 2,储存于 -20°C
• WT Pico 扩增试剂盒,模块 3,储存于 4°C
• Clariom D 30 阵列,人类,储存于 4°C
• 杂交对照试剂盒,储存于 -20°C
• WT Pico 扩增试剂盒,模块 1,储存于 -20°C
• WT Pico 扩增试剂盒,模块 2,储存于 -20°C
• WT Pico 扩增试剂盒,模块 3,储存于 4°C
• Clariom D 30 阵列,人类,储存于 4°C