Search

Applied Biosystems™
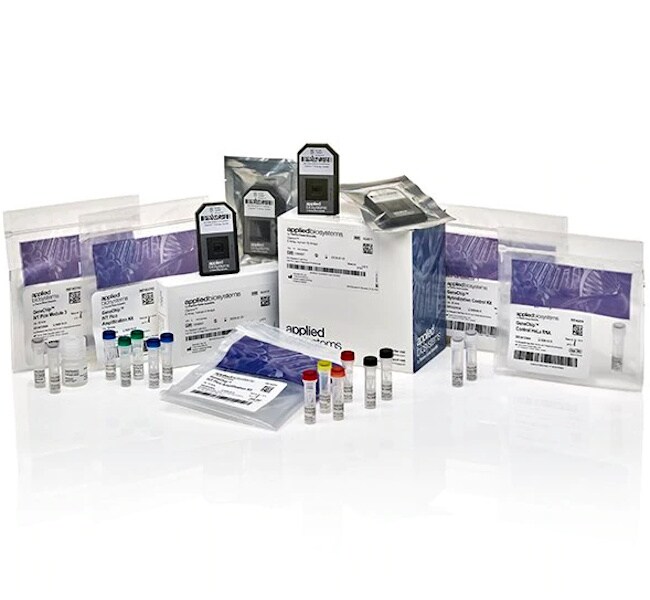
Clariom™ S Pico Assay, mouse
Obtain a gene-level view of the mouse transcriptome with the Clariom S Pico Assays for mouse. The Clariom S PicoRead more
| Catalog Number | Number of Arrays |
|---|---|
| 902933 | 30 arrays |
Catalog number 902933
Price (CNY)
-
Number of Arrays:
30 arrays
Obtain a gene-level view of the mouse transcriptome with the Clariom S Pico Assays for mouse. The Clariom S Pico Assays, mouse serve as a next generation transcriptome-wide gene-level expression profiling tool, which allow for the fastest, simplest, and most scalable path to generating actionable results. Based on industry-leading microarray technology, the novel mouse Clariom S Assay design provides extensive coverage of all known well-annotated genes, compatibility with clinical sample types, scalable formats, and flexible data analysis software. Clariom S Pico Assays are the tools of choice to find expression biomarkers with known function as quickly, easily, and cost-effectively as possible.
Find answers, move on
Although the number of known transcribed genes has expanded rapidly in recent years, knowledge of the function of each gene is still evolving. Many genes and transcripts found in databases are poorly annotated or unannotated, which can complicate and prolong data analysis and interpretation. mouse Clariom S Pico Assays focus on well-annotated genes, providing researchers with the ability to perform gene-level expression profiling studies and to quickly assess changes in key genes and pathways. With less time required for data analysis, Clariom S Pico Assays for mouse help researchers reach conclusions more rapidly.
Simple, swift biomarker discovery
• Accurately measure gene-level expression from >20,000 well-annotated genes to get to answers quickly.
• Choose a format that suits your throughput needs, processing from 1 to 192 samples a day.
• Go from data to insight in minutes with intuitive, highly visual, free analysis software designed for the biologist.
When you have precious samples, get it right the first time
• Generate robust expression profiles from as little as 100 pg of total RNA–as few as 10 cells.
• Utilize RNA from various sample types including blood, cells, and fresh/fresh-frozen or FFPE tissues.
• Preserve sample integrity and reduce data variability with an assay that does not require a globin or rRNA removal step.
• Save time and money with fully automated sample preparation options.
Clariom S solutions are available formats for single-sample (cartridge array) processing on the GeneChip™ 3000 instrument system and high-throughput automated processing (plate array) on the GeneTitan™ Microarray System, offering the flexibility to accommodate both small and large cohort studies. The complete solution comes with reagents and fast, simple Transcriptome Analysis Console (TAC) software to analyze and visualize global expression patterns of genes, pathways, and network interactions in minutes.
Get the truest level of gene-level expression
To generate robust gene-level expression, mouse Clariom S Assays detect only the exons present in all known transcript isoforms expressed from a single gene locus-constitutive exons. This differs from other gene-level array technologies and shallow RNA-Seq, which provide either a biased view of gene expression or data that are complicated by variation in expression of transcript variants. By detecting only constitutive exons throughout the length of each known gene, mouse Clariom S Assays generate the most accurate and truest measurement of gene-level expression available today.
Keeping biomarker identification across the transcriptome simple and swift, Clariom S Pico Assays for mouse provide you with the coverage you require, the reproducibility you need, and the insights you want to act on your discoveries.
For Research Use Only. Not for use in diagnostic procedures.
Specifications
ArrayTranscriptome Profiling
Array FormatCartridge
For Use With (Application)Microarray Analysis
No. of Reactions30
Number of Arrays30 arrays
Product TypeS Pico Assay
Quantity30 reactions
SpeciesMouse
Sample TypeRNA
Unit SizeEach