Search

Applied Biosystems™
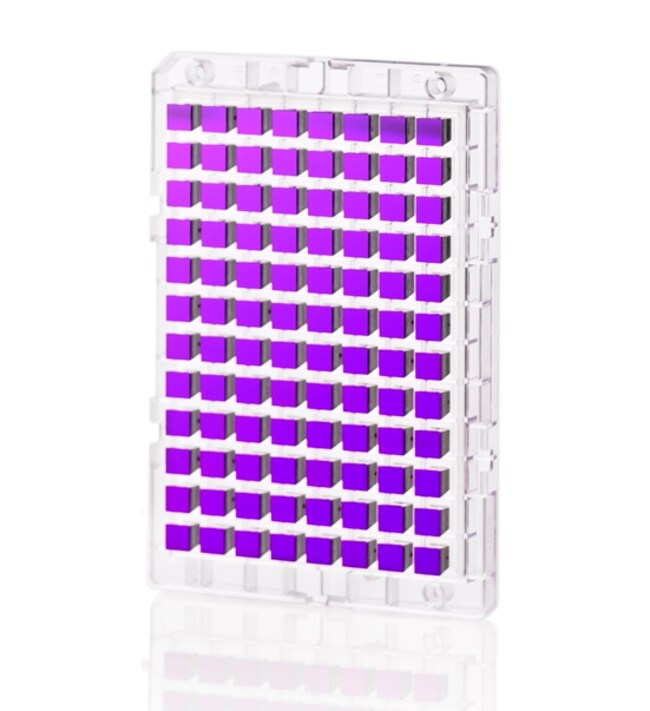
GeneChip™ CHO 基因 2.1 ST 阵列板
Comprehensive designThe Chinese hamster ovary (CHO) cell lines were introduced in the 1960-s and has become an extremely important tool了解更多信息
| 货号 | 数量 |
|---|---|
| 902147 | 1 plate |
货号 902147
价格(CNY)
-
数量:
1 plate
Comprehensive design
The Chinese hamster ovary (CHO) cell lines were introduced in the 1960-s and has become an extremely important tool for biomedical research biopharmaceutical manufacturing. Their rapid growth, stable gene expression profiles and high protein production makes them ideal for both research studies and for the production of therapeutic proteins.
To help further your research and improve manufacture yield, we have introduced the Applied Biosystems™ CHO Gene 2.1 ST Array Plates, with an expression array design that provides the highest coverage of the transcribed genome. We use a comprehensive collection of information sources to design probes that interrogate up to 23 unique sequences of each transcript. This design strategy provides you with the ability to evaluate whole-transcriptome gene expression at the gene and exon levels, which allows the study of transcript variants and alternative splicing events.
This unique array design is based on the most recent genome content and offers the high probe coverage of every transcript measured by this array. The high transcript coverage of this array design yields accurate detection for genome-wide transcript expression changes and provides higher resolution and accuracy than other classical 3--biased microarray solutions on the market. The whole-transcriptome analysis approach enables researchers to detect multiple transcript isoforms from a given gene, including those that could be missed using a 3--biased expression design, such as splice variants, non-polyadenylated transcripts, transcripts with alternative polyadenylation sites, and truncated transcripts.
Applied Biosystems CHO Gene 2.1 ST Array Plates are designed exclusively for Applied Biosystems GeneTitan™ Instrument–the hands-free microarray system that allows you to process 16, 24, or 96 samples in parallel. For more information on GeneTitan Instrument, please visit our GeneTitan Instrument Page.
Key benefits
• Whole-transcript analysis the capture of transcript isoforms you may miss with 3--biased expression designs
• Comprehensive transcriptome coverage provides the best opportunity to discover interesting biology:
- >21,000 protein coding transcripts
- >19,000 Entrez genes
- Measure alternative splicing events/transcript variants with probes designed to maximize coverage of exons
- Reproducible: Signal correlation coefficient ≥0.99
Content profile
See Fig. 1 and Fig. 2 (attached) for summaries of the array content and data sources used to design Applied Biosystems CHO Gene 2.1 ST Array Plates.
仅供科研使用。不可用于诊断程序。
规格
产品线GeneChip
数量1 plate
类型CHO 基因 2.1 ST 阵列板
数组转录组谱分析
产品规格阵列板和托盘
阵列数量96 阵列
种属中国仓鼠
Unit SizeEach