Search
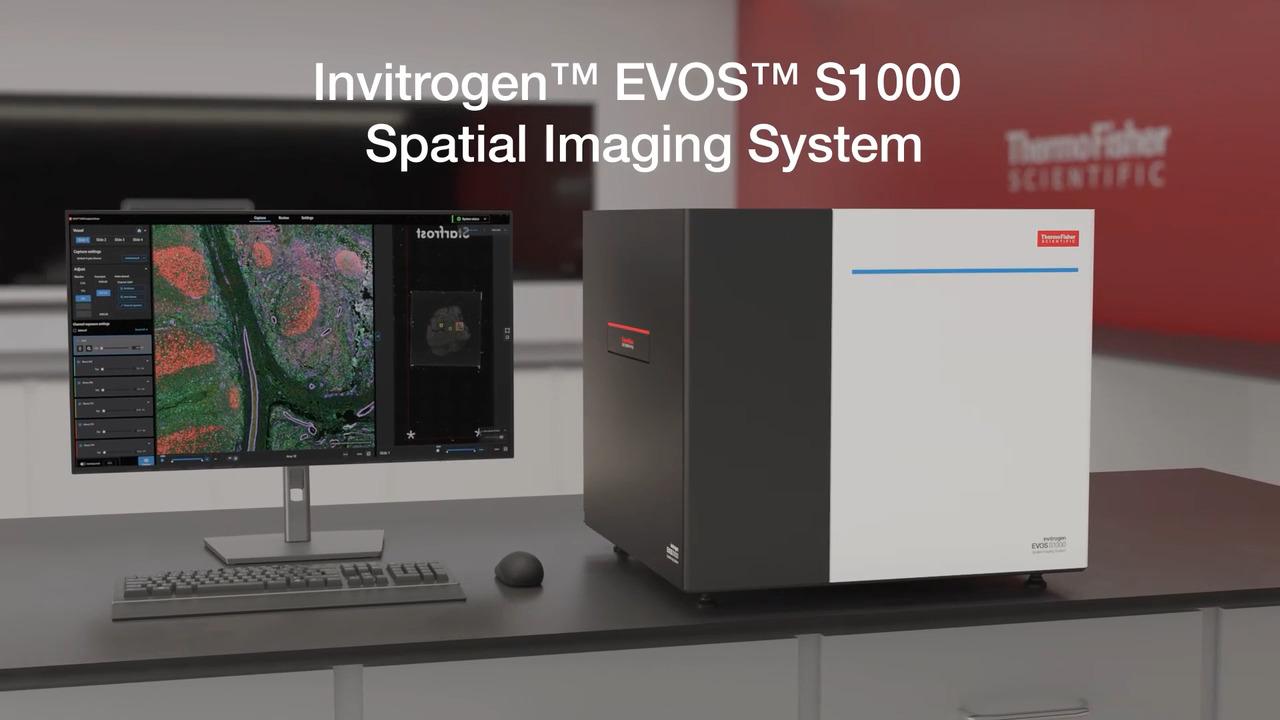
EVOS S1000 空间成像系统可快速获得可发表级质量的9重组织成像结果
EVOS S1000 空间生物学成像分析系统可在一小时内完成从图像采集、处理到生成高分辨率图像的蛋白靶标空间定位分析,且在一次实验中实现多达9种荧光成像。EVOS S1000 空间成像系统有助于深入了解组织微环境、细胞间的相互作用和空间定位。
技术优势
- 简便——一次可完成9重组织成像,无需光漂白或循环染色
- 快速——数小时内可完成多个样本的大图拼接和光谱拆分后的多重荧光图像
- 灵活——兼容各种荧光染料、抗体、空间组学试剂以及多种分析软件
- 结果更丰富——在更短的时间内获得更多的成像数据

色彩更丰富,场景更完整,洞察更深入。
EVOS S1000 空间成像系统可同时采集和解析多达九色荧光(八个荧光靶标加上核染色),简化了多色组织成像实验流程,并实现了强大的图像可视化。与常规成像技术(1-4色)相比,单轮9重成像可为下游分析生成显著更多的数据,且实验成本比循环成像少很多。

图1. 同时检测更多靶标有助于提供组织微环境的更多细节,展示了组织内生物系统的复杂性。使用9重抗体组合染色的正常结肠(左)和腺癌组织(右)图像在EVOS S1000空间成像系统的结果。多重免疫荧光染色能够充分显示组织微环境中相关生物分子和细胞的定位及相互作用的详细信息。

图2. 多重组织成像技术可同时检测样本中的更多靶标。 小鼠肾脏FFPE样本用8种Aluora染料染色,经光谱拆分后的多视野成像结果,8个蛋白靶标分别为水通道蛋白1、2和4,细胞角蛋白8、18和19,MCM2和平滑肌肌动蛋白(SMA),并用DAPI复染。图1-4显示了同一样本区域增加标记的靶标数量可生成更丰富的原位组织信息。所有图像均使用Invitrogen EVOS S1000空间成像系统的20倍物镜进行采集。
表1. 多重免疫组化染色的技术优势
|
单色 |
2 - 4色 |
多重染色 (≥5色) |
蛋白定位 |
|
|
|
蛋白质共定位 |
|
|
|
生物标志物表达 |
|
|
|
同一样本中RNA和蛋白质同时检测 |
|
|
|
复杂的细胞表型分析 |
|
|
|
组织结构 |
|
|
|
组织微环境的细胞表征 |
|
|
|
性能特征
EVOS S1000 空间成像系统可实现以下功能:
- 可进行光谱荧光、透射明场、相差和彩色明场成像
- 使用420万像素、16位 sCMOS 相机检测组织内复杂的多重染色结果
- 5位物镜滑台上可选择不同类型的物镜(2.5 ~ 40倍)
- 在1小时之内以20倍物镜扫描,经光谱拆分、拼接并保存1平方厘米组织区域的9色荧光图像
- 图像采集过程中可实现自动光谱拆分功能,以解析光谱重叠的荧光染料信号
- 无论经验水平如何,可轻易操作仪器,进行全片扫描、组织预览、光谱解析、图像采集和数据检索
- 生成单层或金字塔结构的 TIFF 或 OME-TIFF 文件,便于后续进行数据分析
- 兼容多种荧光标记技术,可选择多种空间生物学相关抗体和试剂
- 无需使用专用耗材,从而降低仪器运行成本
推动空间组学研究的多重荧光成像技术
观看并了解多重荧光成像技术在空间组学方面的研究进展。探索 Invitrogen EVOS S1000 空间成像系统如何简化实验流程、支持多种荧光染料,并实现快速、高分辨率成像。了解 Invitrogen Aluora 空间扩增试剂如何提供灵活的、高灵敏度和明亮的抗体选择;了解如何使用与荧光染料偶联的一抗进行快速简便的多重成像技术;以及何时使用 Invitrogen ReadyLabel 等多种抗体标记试剂盒。
Good morning or good evening, everyone, depending on where you are in the world. My name is Adyary Fallarero, and I am a senior manager in product management for imaging technologies at Thermo Fisher Scientific. I'm located in Finland. Hello, everyone. My name is Chris Langsdorf, and I'm a global product manager in protein and cell analysis, also at Thermo Fisher Scientific, and I'm in the United States.
We are both super grateful to have you all attending our talk, and today we will be sharing with you all of the new tools that our company has recently developed to advance multiplex imaging for spatial proteomics research. We hope you'll benefit and gain new knowledge on spatial biology. Feel free to get in contact with us and our teams afterwards if you need any more information or if you have questions.
So let's get started.
We'll jump right in and look at new tools to tackle multiplex imaging challenges in spatial proteomics. Our agenda today includes looking briefly at the revolution in spatial biology, examining some challenges that arise when we start to look at multiplex proteomic imaging, and discussing how we've addressed these challenges using both sample labeling and imaging and analysis techniques.
Spatial biology provides us better insights into our samples primarily because we're able to analyze not just single cells, but also their context in a larger environment. We can use antibody-based detection to tell us what cell types are present and the state of those cells, such as their metabolic or activation state, and what functions they're carrying out. Because our samples are generally fixed, we can get an idea of their identity in both time and space. By studying multiple cell types simultaneously, we can understand the interaction of those cells and how they form larger and more complex neighborhoods or networks.
We can begin to understand both the tissue microenvironment and the architecture of our sample in its native state. Let's look at an example of how this works. We can image an entire tissue section and zoom in on one section of the sample to understand the spatial context. By displaying multiple different colors, we can see the location of different cell types as they exist in their native environment. Then we can use our analysis tools to mask and identify the different cell types that we've labeled with antibody-based detection. We can go a step further with our analysis and ask questions like, "What is the nearest neighbor to each of these cell types?" and begin to understand the network and architecture of our sample in much greater detail.
Several challenges arise when we switch to this type of spatial workflow. Generally, with microscopy, we use primary antibodies followed by fluorescently labeled secondaries. When we move from three or four antibody-based targets up to eight, secondary antibodies are no longer useful. We need to pivot and begin using primary antibody conjugates. As we see here, the primary antibody labeling workflow is very fast. We can make a cocktail of all of these antibodies and label our sample in about an hour. There are some drawbacks, though, such as a generally limited catalog menu available of these conjugates. Unlike with secondary-based detection of three or four targets, where we always choose the three or four brightest dyes available, here we need to choose dyes based on their spectral properties and not necessarily on their brightness.
Fortunately, there's a solution to this challenge provided by the Aluora Spatial Amplification Reagents. Here we use a three-step workflow. First, we label our sample with a primary antibody, followed by a wash and then labeling with a secondary antibody HRP conjugate. After this, we add our Aluora spatial amplification reagents, which are covalently attached to our sample in the location of our antibody binding. After this step, all of the antibodies are stripped off our sample, leaving just a very bright fluorescent labeling in the location of each antigen that was originally present. As we can see on the left, after one round of labeling, we can see the location of one antigen of interest. After repeating, we can see a second, third, fourth, and up to eight plex with great sensitivity and very bright signal. This gives us a lot of flexibility in how we choose and use our antibodies. Because amplification is provided, we can use substantially less antibody, and we're not required to covalently attach a dye to the antibody. The drawback here is it's a longer workflow, so we have to go through multiple labeling cycles.
The Aluora Spatial Amplification Reagents are compatible with primary antibody conjugates. You see two examples here where the primary antibody conjugates are labeled with a few of our brightest dyes available, such as Alexa Fluor 647 and 594, which give us great signal to background for these primary conjugates. With either a less bright dye or a lower expressed antigen, we switch to the Aluora spatial amplification reagent to give us that signal to background that we need. As far as the availability of primary antibody conjugates, there are a few ways besides just acquiring these from a catalog. These are quite available to produce as a DIY method. There are kits available that make it very easy to label your antibody with your dye of choice that's compatible with the system, either by assembling a kit using your own purification system, or we have a technology called ReadyLabel that does two things: it both purifies your antibody and then labels it with one of these eight compatible dyes and gives you a purified conjugate. Or if you ship your antibody to us, our experts will conjugate it and return it back to you. There is a lot of flexibility and convenience available with these options. However, they can be a bit more expensive than just acquiring a conjugated antibody from a catalog.
Thanks so much to Chris for sharing with us the labeling tools that we've been developing to advance spatial proteomics research. Now we're going to switch gears a bit and focus on instrumentation, specifically fluorescent microscopy instrumentation. You all are very aware that fluorescent microscopy can be and has been extensively used to investigate how single cells are organized into a tissue microenvironment, and none of the currently available technologies are really perfect. They all have benefits and drawbacks. What we've tried to do from our perspective is tackle some of the drawbacks of the currently available instrumentations and progress in that manner the type of research that spatial biology scientists can perform. I start maybe with a bit of an overview of what we currently have available and then how we have addressed the current limitations of the existing technologies.
I think you are all very well aware that a great body of research that has been done around spatial proteomics has been done using cyclic labeling and imaging. Imaging that is done in this approach is really pretty conventional. There are between two to four fluorescent channels that are used on those instruments. The benefit of this approach is that because it is performed in a cyclic manner, it allows for a high number of protein targets to be interrogated. The drawback, on the other hand, is that because it's a cyclic process, it tends to be of a lower throughput, and because it is constant illumination of the sample and they go through certain rounds of stripping, that can damage the integrity of the tissue.
The approach that we have taken and that we have tried to address the current limitations is really spectral imaging. Spectral imaging allows for the capture of simultaneous fluorophores within one single round. Instead of only doing the conventional two to four channels, maybe even five fluorescent channels in one single go, the aim of spectral imaging is to capture between seven to ten, even sometimes more, fluorophores in a single round. There is an advantage from doing this: tissue gets better preserved. However, there is also a drawback, and the drawback comes from the fact that when there are so many fluorophores that get acquired in a single imaging round, there is signal bleed-through that needs to be eliminated.
If we try to understand a bit more why this drawback exists in spectral emissions and where it comes from, we can go to the root cause of that problem. The root cause is that the majority of the fluorophores used for spatial imaging have a very broad emission spectrum. If we are imaging ECAD in a 514 channel, the emission spectra of the 514 channel will also appear and show up in both neighboring channels, such as 488. To resolve that signal and remove that bleed-through, we can apply a mathematical process called unmixing. Unmixing is a relatively straightforward process by which we establish the relative contribution that each fluorophore used in that specific protocol has to every pixel of the image. This is done by acquiring spectral signatures from the unstained tissues to account for the typical autofluorescence seen in biological samples, and then from the individually stained fluorophores on the same tissue where the assay is being performed.
Using spectral emission, protein targets can be easily resolved and discriminated even if the fluorescent spectral signals overlap. As you can see in the bottom images shown here, ECAD in the 514 channel can be very clearly discriminated from the CD163 and the PD1 signal that appears in the two neighboring channels. This main drawback associated with spectral technologies is something that we truly wanted to address with our new instrument. Our new instrument is launching now in the fall and is called Invitrogen EVOS S1000 Spatial Imaging System. We have paid a lot of attention to simplifying the unmixing workflow, keeping it very straightforward. It also performs in a way that it is part of the acquisition, done on the fly while the images are being acquired. We have also tried to verify the quality of the unmixing. We provide substantive data as part of a quality report that allows the user to understand the quality of the unmixing that has been performed.
We have gone beyond improving the unmixing workflows by addressing other challenges encountered with currently existing spectral imagers. One of them is the fact that they are often restricted to very specific labeling methods. We have tried to expand the number of dyes that can be utilized and the type of technologies that can be used with EVOS S1000. We have also tried to make it fast so you don't have to spend hours to acquire a 9-plex. You can do it in a single round. EVOS S1000 allows users to acquire up to 8 protein targets and DAPI, making for a 9-plex, while keeping a high resolution of 325 nanometers per pixel at 20x. Last but not least, it's about making spatial proteomics and spatial biology accessible to a broader audience so that many more researchers can utilize spatial biology and study biological processes using these tools. We are not making it simple, but we are trying to make it simpler.
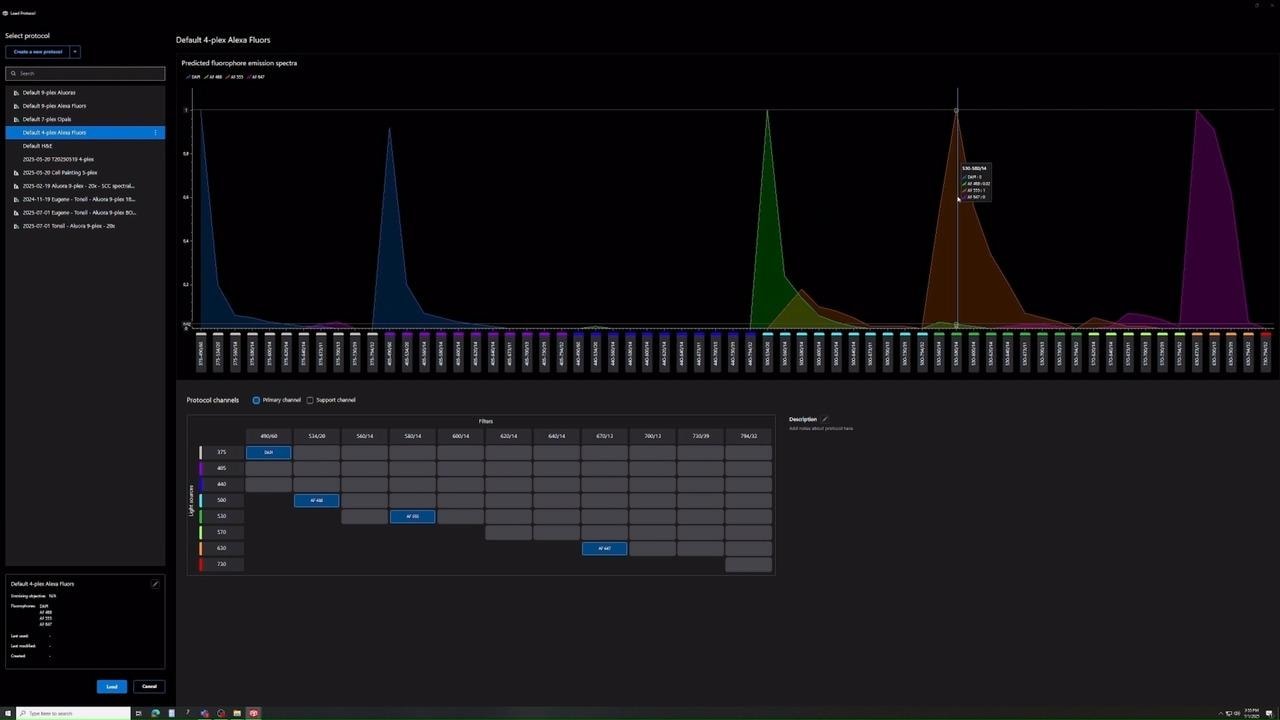
Let's go through the challenges that are presented in currently existing spectral imagers. The first one is that unmixing tends to be limited to very specific dyes that are often proprietary. We have tried to address that issue. When you generate a protocol with EVOS S1000, you will be presented with a repertoire of dyes, roughly around 30 dyes, that includes Alexa Fluor, Alexa Fluor Plus, and special amplification reagents such as Aluora Spatial Amplification Reagents and dyes. You can select the dyes, and the software will show you the overlap that exists on the emission spectra of those dyes that have been selected. We then set up a channel configuration automatically that will acquire the primary channels, shown in blue, as well as the support channels needed to eliminate bleed-through from the proximity of the spectral signals. This is done completely automatically without any user input. The user can also define the product targets on the assay.
Another challenge we have tried to address is the complexity of performing unmixing for anything higher than a 7-plex. Our solution is using the same unmixing workflow regardless of the plex. If you go to a 7-plex or all the way to a 9-plex, the workflow remains the same. First, an unmixing matrix needs to be generated by extracting spectral data from images. Users will need to first acquire an image of their unstained tissue slide and then individual single-color calibrator slides. Once that happens, you can utilize that protocol and start setting up a 9-plex assay. The system will start to acquire images in every single field of view, and at the same time, unmixing will be triggered as part of the image acquisition workflow. You can acquire a 1-square-centimeter 9-plex image that is fully unmixed and stitched in an OMET file format within roughly one hour using a magnification of 20x.
The unmixing workflow eliminates the need for any post-processing. Users should not only subjectively assess the quality of their unmixing. We have addressed this issue by generating an unmixing quality metrics report that contains both raw images versus the unmixed image for qualitative assessment and quantitative parameters that allow users to estimate the quality of the unmixing. We provide clear cutoff values and troubleshooting tips to improve the unmixing process if needed.
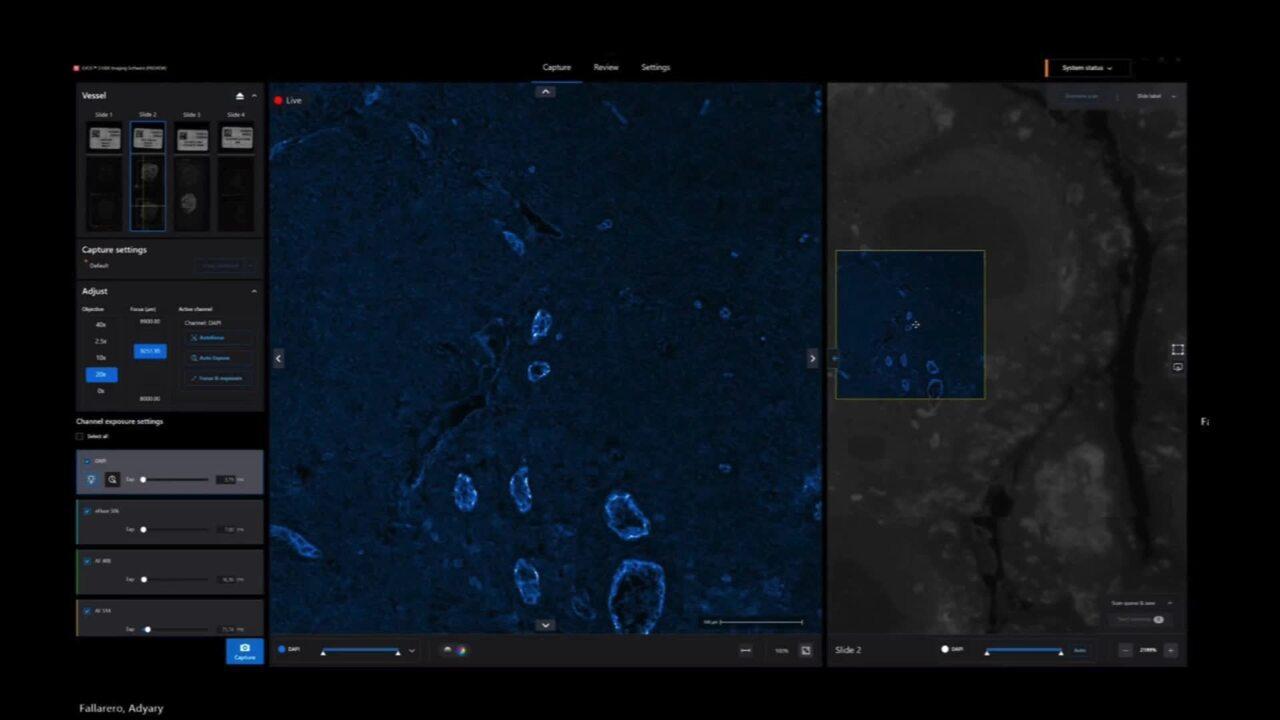
We believe that every system and method for microscopy needs to be simple and intuitive, even for users new to the space. We have a proprietary feature called Periscope mode that allows users to turn on any channel and explore their tissue, making it practical and simple for new users to interact with. We aim to provide sophisticated simplicity that allows anyone to quickly gain confidence and easily set up, acquire, and visualize 9-plex images.
The EVOS S1000 can be utilized with multiple labeling strategies. Examples of results obtained using Aluora special amplification reagents show very bright signals that can easily discriminate between targets with low expression levels. The EVOS S1000 can also be used with primary conjugates, allowing for a quick labeling step completed within about two hours at 20x, including unmixing and processing of the data to generate an OME TIFF file. If primary conjugates are not available, another option is to directly conjugate primary antibodies using ReadyLabel kits. This approach is compatible with the EVOS S1000 and provides flexibility in labeling strategies.
The EVOS S1000 Spatial Imaging System is a novel alternative in the spatial imaging space. We aim to provide a choice of achieving high multiplex ability in a single emission step without the complexity of a laborious unmixing workflow. We have made it simple and reliable, providing quality metrics and flexibility in using spatial amplification reagents or validated primary antibody conjugates. We are happy to answer any questions and be a partner in your spatial biology journey. Thank you so much for joining the talk.
借助 EVOS S1000 空间成像系统克服传统免疫组织化学的局限,从而获取组织中更多生物学信息
进行单重或双重染色的局限性,这款空间生物学领域的创新性仪器可提供组织微环境和其原位结构的全景图(图1,见上文)。
- 光谱拆分技术
- 多重免疫荧光技术的优势
- 实验流程
- 为何选择空间成像技术?
通过自动拆分生成高分辨率多重免疫荧光图像
EVOS S1000 成像系统光谱拆分技术的优势
EVOS S1000 空间成像系统软件可在需要时自动进行光谱拆分。光谱拆分是一种用于解析具有显著光谱重叠的荧光信号的过程,通过消除对光谱特征截然不同的荧光染料的需求,扩展单轮成像实验中可以检测的靶标数量,从而实现比传统荧光显微镜更高效的多色成像(图3)。
观看 EVOS S1000 空间成像软件中的光谱拆分实操。滑动下方红色按钮可切换原始图像和光谱拆分后的图像
这种拆分过程利用每种荧光染料的独特光谱特征来确定每个像素处不同荧光信号的丰度,从而实现对染色样本中各种荧光染料的精确鉴定和定位。为了使算法有效运行,需要使用参考光谱来提取每种荧光染料的特征,可通过使用仪器预置光谱(默认)或通过制备单色对照样本的光谱来获得。此外,需要未染色样本来确定组织的自发荧光,该自发荧光将与实验中使用的荧光染料一起作为独立的光谱特征被提取出来。

图4. 因其光谱拆分功能,EVOS S1000 空间成像系统可采集多重免疫荧光图像。 这些光谱是八种Alexa Fluor、Alexa Fluor Plus染料和DAPI的发射光谱。尽管存在光谱重叠,但EVOS S1000空间成像软件中的内置算法可以确定每种荧光染料对图像每个像素点的相对荧光强度,从而消除重叠通道中的光谱溢漏。
一旦所有这些信号采集完毕,EVOS S1000 软件就会生成拆分矩阵并将其保存到成像方案中(图5)。

图5. EVOS S1000 空间成像系统通过其光谱拆分能力生成多色成像数据。 该软件功能允许研究人员可同时观察所有通道,并提供光谱解析质量报告以利于生成高分辨率数据。
评估光谱拆分质量,增加数据透明度
在全片组织扫描之前,利用光谱拆分质量评估报告(Unmixing Quality Metric Report)可对本次实验方案进行评估(图6)。该报告提供了光谱拆分前后各个荧光通道的光谱干扰情况,荧光通道之间的干扰经光谱解析后应被消除。

图6. 展示了原始图像(左)和光谱拆分后的图像(右),每列显示单色对照样本和每行显示其主要荧光通道。
传统单色荧光成像主要检测特定蛋白的表达情况

图7. 每张图片显示了染色的侵袭性导管癌。经DAB或苏木精染色后的人乳腺侵袭性导管癌组织标本,每张图片检测的目标蛋白不同,所有图像均通过EVOS S1000空间成像系统进行采集。
多重免疫组化染色可充分展示组织内生物学系统的复杂性

图8. 采用8种Aluora空间扩增试剂和DAPI染色后的侵袭性导管癌组织。人乳腺侵袭性导管癌组织样本经Aluora Spatial Rainbow Kit(货号A40002450)染色后,通过EVOS S1000空间成像系统进行图像采集及光谱拆分。通过单细胞分割与表型分析揭示免疫细胞亚群的空间分布特征,多重免疫荧光拼接图像的分析在Indica Labs HALO软件(版本4.0.5107.318)中完成。
简化的组织成像实验流程
与传统成像技术需要数天至数周的处理周期不同,EVOS S1000空间成像系统可在数小时内完成全流程成像。其显著的时间优势体现在:能够为多个样本同步生成完成拼接、解混处理的多重成像结果。该系统兼容多种标记技术,支持用户自由选择惯用的抗体与试剂。仪器输出的OME-TIFF格式文件可直接适配第三方分析软件(如Halo与QuPath等)(QuPath: Open source software for digital pathology image analysis. Scientific Reports (2017).)

图9. 空间生物学多重免疫荧光实验流程,利用EVOS S1000空间成像系统的光谱拆分技术实现对生物标志物的多重检测。
为EVOS S1000空间成像系统设计实验方案时,首先需根据研究目标选定待测的蛋白靶标;接下来筛选荧光标记抗体构建实验方案,可通过 Invitrogen SpectraViewer (光谱查看器)确定标记抗体的8种荧光染料和DAPI的最佳光谱组合。在选择染色标记技术时,可使用我们的Spatial Biology Reagent Selection Tool (空间生物学试剂筛选工具)选择合适的实验方案;最后通过成像步骤完成样本采集与分析。
通过先进的空间成像系统和多重免疫荧光技术获取更丰富的生物学信息,从而展现组织的复杂性
借助EVOS S1000空间成像系统生成更具科学价值的图像。其输出的OME-TIFF格式图像兼容多种数据分析软件,可实现以下维度的检测:
- 细胞类型、细胞状态与细胞功能
- 细胞在时空维度上的鉴定
- 细胞间相互作用
- 相邻细胞间的网络结构
- 天然状态下的组织微环境与空间结构

图10. 在EVOS S1000空间成像系统上8种免疫标志物和DAPI染色的结肠癌组织成像结果。荧光抗体包括:α-SMA Alexa Fluor 420、CD68 Alexa Fluor Plus 488、CD20 Alexa Fluor 514、CD4 Alexa Fluor Plus 555、CD8 Alexa Fluor Plus 594、FoxP3 Alexa Fluor Plus 647、Pan-CK Alexa Fluor 700、Ki-67 Alexa Fluor Plus 750。

图11. 左图为图10中圈示的结肠腺癌三级淋巴结构(TLS)的局部放大图像。右图显示通过HALO分析软件进行细胞核分类与细胞表型分析后,该三级淋巴结构内的细胞表型分析结果。
光谱拆分技术的优势

成像速度更快
相比传统的循环染色技术,使用 EVOS S1000 空间成像系统可以显著加速多色荧光实验。利用具有光谱拆分功能的先进软件,更快地完成一轮完整的9色免疫荧光成像实验。

降低组织损伤的风险
防止严重的组织损伤。使用漂白或抗体去除方法进行重复染色时,由于抗体孵育时间延长使得整个实验时间冗长,并且存在表位丢失、组织降解和荧光染料淬灭的风险。

对您的实验充满信心
使用 EVOS S1000 空间成像系统的自动光谱拆分功能,对染色后的多重组织样本进行荧光成像,让您高枕无忧。EVOS S1000 软件可自动生成拆分矩阵,并将其应用于光谱重叠的多重组织样本,清晰识别溢漏到邻近通道的荧光信号。
自发荧光去除
利用 EVOS S1000 空间成像系统的光谱拆分技术增加成像的精确度,提高细胞检测的准确性。
使用 EVOS S1000 空间成像系统软件的先进光谱拆分技术,从待测靶标中去除自发荧光信号。
去除自发荧光的优势
EVOS S1000 空间成像系统软件可以对组织的自发荧光进行光谱拆分,有效地将高自发荧光信号与待测的荧光染料分离开来。自发荧光在所有组织细胞中都有不同程度的表达,并且通常在DAPI等荧光通道中最强。如果不去除自发荧光,其会干扰下游结果分析。
观看 EVOS S1000 空间成像软件通过光谱拆分去除自发荧光的实操,滑动下方红色按钮切换原始图像和拆分后图像。
与荧光标记之间的光谱拆分非常相似,利用自发荧光和荧光染料之间光谱特征的差异进行自发荧光去除。该技术确定每个光谱特征的信号丰度,从而实现高度光谱重叠的荧光染料间的精确分离。
提高下游细胞检测的准确性
如果不进行自发荧光去除,由于无法确定荧光信号是待测标记物或DAPI的特异性表达还是组织的自发荧光,所以下游图像分析将变得更加困难。通过从DAPI染色中去除组织的自发荧光信号,可以使用不同的核分类方法获得准确度更高的细胞分类结果。

图13. 未进行光谱拆分(上图)与经光谱拆分并去除自发荧光后(下图)DAPI染色的细胞成像结果。


了解用户对 EVOS S1000 空间成像系统的评价
客户案例:瑞典斯德哥尔摩 SciLifeLab,空间蛋白组学部门
使用 Invitrogen EVOS S1000 空间成像系统简化了组织成像实验流程,并在不到一小时内提供多色荧光数据。
订购信息
每台 EVOS S1000 空间成像系统 (货号: AMFS1000)均包括主机、物镜、载玻片支架、质控样片和一年保修服务。
Every EVOS S1000 Spatial Imaging System (Cat. No. AMFS1000) includes the imaging unit as well as the objectives (1 of each type), slide holders (4), calibration slide, and AB Assurance support plan listed below.
资源与技术支持


出版物
应用指南
科学海报
选择指南
技术参数表
其他文章
操作教程视频
Invitrogen EVOS S1000 空间成像系统在中美洲和南美洲除外的所有国家和地区均可销售。
HALO 是 Indica Labs, Inc. 的商标。
仅用于研究。不用于诊断程序。